

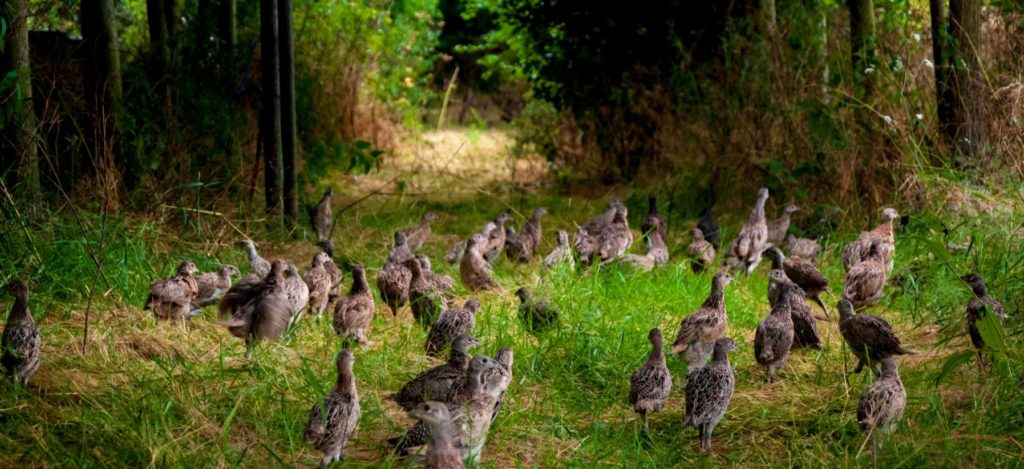
Last autumn, just over a year ago, Wild Justice won a very significant victory by challenging the lawfulness of the massive scale of releases of non-native Pheasants and Red-legged Partridges for the purpose of recreational shooting. Our challenge caused DEFRA to list the two species on Schedule 9 of the WildlIfe and Countryside Act which makes it an offence to release these birds into the wild in England without a licence, but at the same time they issued a general licence that exempted all areas away from designated wildlife sites from these restrictions. We criticised the new regulations as being too weak, although they are a start. The regulations currently apply to England but not to Wales, Northern Ireland or Scotland.
How have the new regulations affected the number of non-native gamebirds released into the countryside? It’s very difficult to tell. We know that Natural England has refused permission to release gamebirds on many SSSIs and we hear from some people (but not from all) that gamebird numbers were noticeably lower in the fields and running about on the roads in the run-up to the opening of the Pheasant-shooting season just over a month ago. But it’s very hard to tell.
So we decided to do a simple piece of analysis using birdwatchers’ data submitted to a scheme called BirdTrack .
We examined the reporting rates of Pheasants (the proportion of full lists of birds seen by birdwatchers which include Pheasants) in England, Scotland and Wales, derived as weekly measures of overall national reporting rate from the BirdTrack scheme. Data from Northern Ireland were obtained but samples sizes were too small to be included. We didn’t include Red-legged Partridges in this analysis.
Analysis focussed on the period between the first week of June (week 23) and the third week of October (week 42), since the regulations came into force in week 23 of 2021 and the data ran to week 42 in 2021. This encompasses the main period of gamebirds releases.
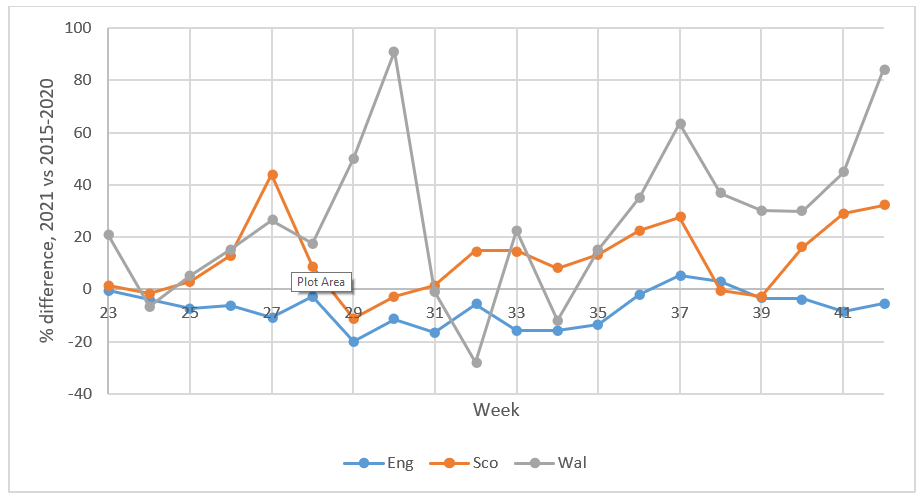
Because mean weekly reporting rates differed systematically between the three countries, the percentage difference in weekly reporting rates between years was assessed, comparing the mean values for weeks 23 to 42 for 2015 to 2020 inclusive (pre-regulation) with the equivalent values for the same weeks in 2021 (post-regulation).
Reporting rates in England were generally lower post-regulation than the average over the years 2015-20 pre-regulation, whereas in Scotland and Wales they were generally higher (Fig. 1). In England, most weekly reporting rates post-regulation fell between the pre-regulation average (a value of zero in Fig. 1) and 20% below it. In Scotland and Wales, weekly reporting rates were generally, but not quite always, higher in 2021 than the 2015-2020 average
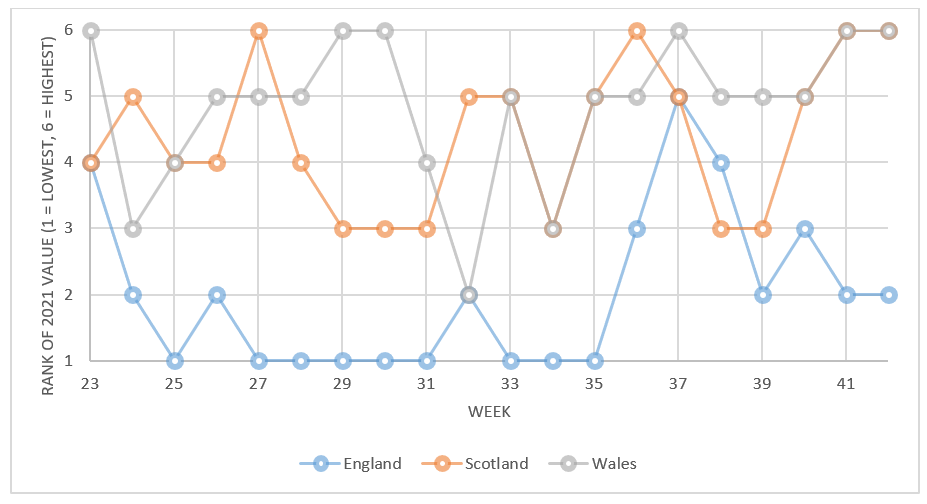
The same pattern was apparent when post-regulation reporting rates were compared with pre-regulation reporting rates using ranks (to account for the fact the pre-regulation average might have been unduly influenced by extreme values). Fig. 2 shows that for England, weekly reporting rates post-regulation were generally among the lowest recorded in the period 2015-2021 (mean rank = 2.0), whereas in Scotland and Wales they tended to be above the median rank (mean ranks of 4.4 and 4.9 respectively).
Formal statistical tests of differences are problematic due to the non-independence of reporting rates across consecutive weeks (serial autocorrelation – a low reporting rate in one week is likely to be followed by a low reporting rate the following week). This means that the effective sample size is likely to be closer to 18 (6 years * 3 countries), than to 360 (6 years * 3 countries * 20 weeks).
Conclusions
There was a strong indication from the data that in the 20 weeks following the introduction of the new regulations in England, reporting rates of Pheasants in England were lower than the recent average, whereas in Scotland and Wales they were higher. This is consistent with, but not conclusive evidence for, an impact of the new regulations in reducing Pheasant releases in England. The higher than average reporting rates in Scotland and Wales in autumn 2021 suggest that the lower rates in England are unlikely to be explained by a systematic effect that applies across the whole of the UK (e.g. related to weather, Brexit, Covid etc). However, whether the lower reporting rates in England can be explained by a new regulation that applies to only a small part of the country is questionable.
This analysis is a bit more than a quick-and-dirty analysis but it’s not ideal. There are more complicated and expensive analyses that could be carried out and we’ll keep them in mind for the future. We plan to repeat this analysis next year to see whether the indications for the first year of regulation are replicated in a second year.
What do you, Natural England and DEFRA think has happened?
We’d be interested to hear of your observations of Pheasants and Red-legged Partridges and whether you think their numbers are higher or lower than in previous years. Our email address is at the foot of this page.
We’ll make this simple analysis available to Natural England and ask them what they think lie behind the apparent findings.
We’ll make these results available to DEFRA and ask them what impacts they think their new regulatory regime may have had.
Acknowledgements
We thank the BTO for providing the data for this analysis.