


Introduction
Last year, in February/March we asked you to consider sending a urine sample to Germany to get the glyphosate levels tested. Over 120 of you participated and the results were quite interesting – click here. We asked the original participants whether they would get another sample tested in the autumn and 59 test results were received.
Results
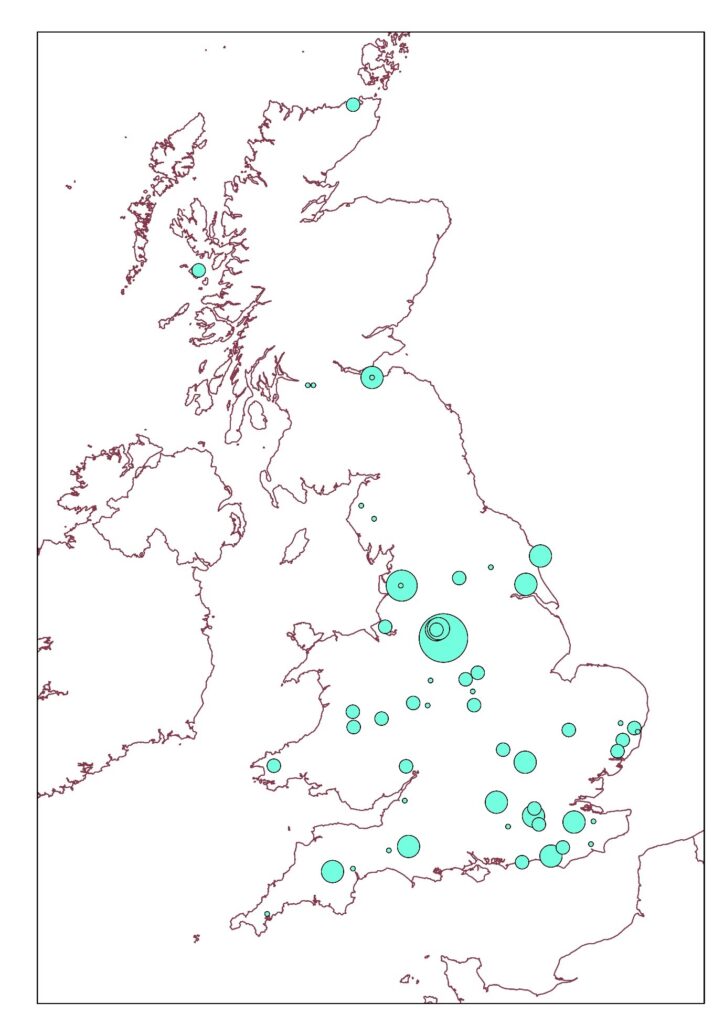
The data came from across Great Britain:
People whose urine glyphosate levels were high in the February/March tests were also likely to be high in the September/October/November tests (Pearson correlation coefficient R=0.49) suggesting some consistency in urine glyphosate levels within individuals.
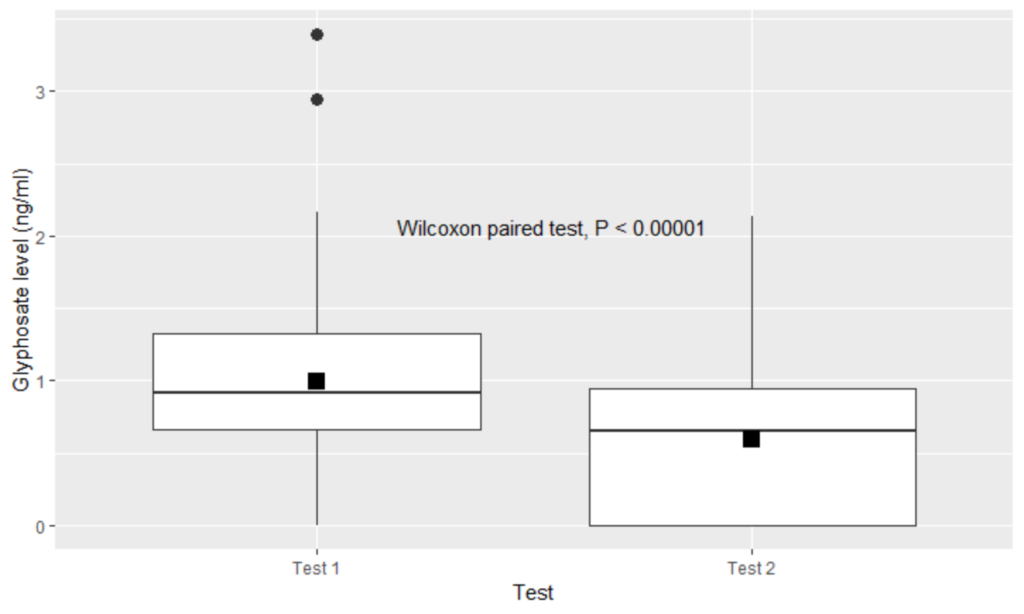
However, urine glyphosate levels were lower, slightly but significantly, in the autumn tests compared with the spring tests.
We could find no relationship between age, gender, diet (omnivore, flexitarian/pescatarian, vegetarian and vegan) and urine glyphosate levels. Our sample of people was not very diverse when it came to gardening habits so those factors revealed nothing.
However, we also looked at land use around the address of the participants using digitised maps like this one:
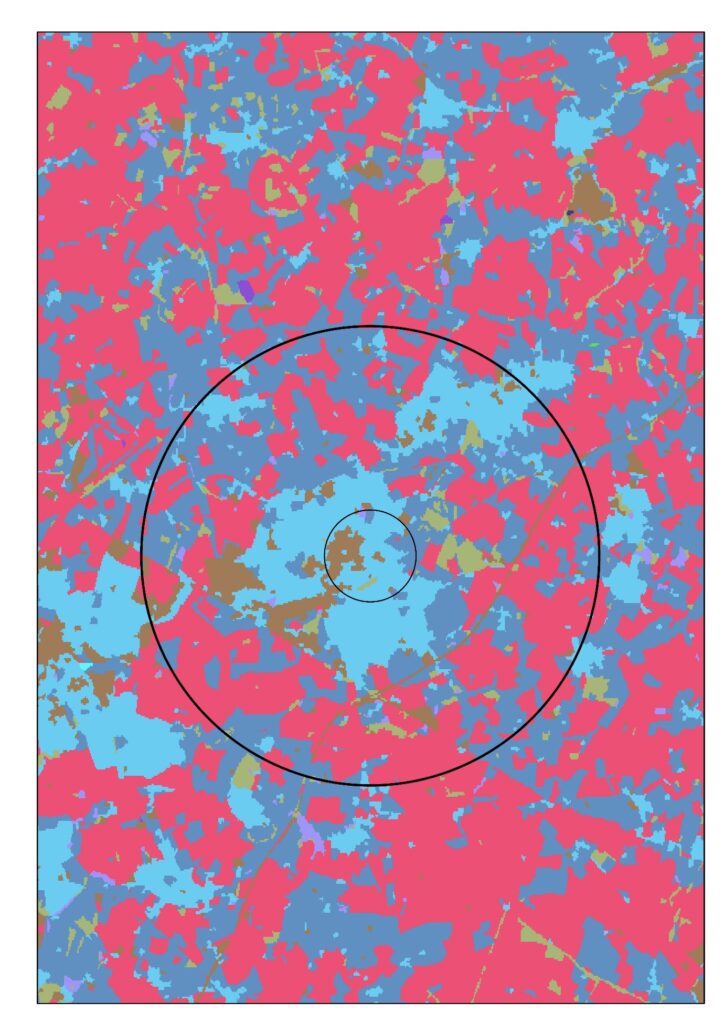
We found a tantalising relationship between urine glyphosate levels (Test 1, where sample size was biggest) and land use. Not significant but intriguing. Which way did it go? Higher urine glyphosate levels came from participants in built up areas. Is that what you expected?
Conclusions
The results suggest that there is a moderate degree of within-subject consistency in glyphosate level between tests, and that there is temporal variation in glyphosate levels, which were higher on average in Test 1 (Feb-Mar 2022) than in Test 2 (Sep-Nov 2022). There was a weak suggestion of a positive relationship between a subject’s glyphosate levels and the amount of built-up land (urban or suburban) around them.
We’re going to share these results with others and ponder what further studies could be built on this basis.
Thank you!
Over 120 people took part in these tests, and 59 in both tests. That makes a reasonable sample of people. It’s a bit of a faff sending off for the test kit, and then sending it off to be analysed (particularly as Brexit has made postage of p*ss to Germany more expensive and involve more paperwork. Many participants refused our offer of reimbursement for postage and the cost of a kit – that meant that the study was much cheaper than it might have been. Thank you very much to all who participated. We’ll get back to you with future plans.