

This post describes a piece of scientific analysis carried out by Wild Justice and friends.
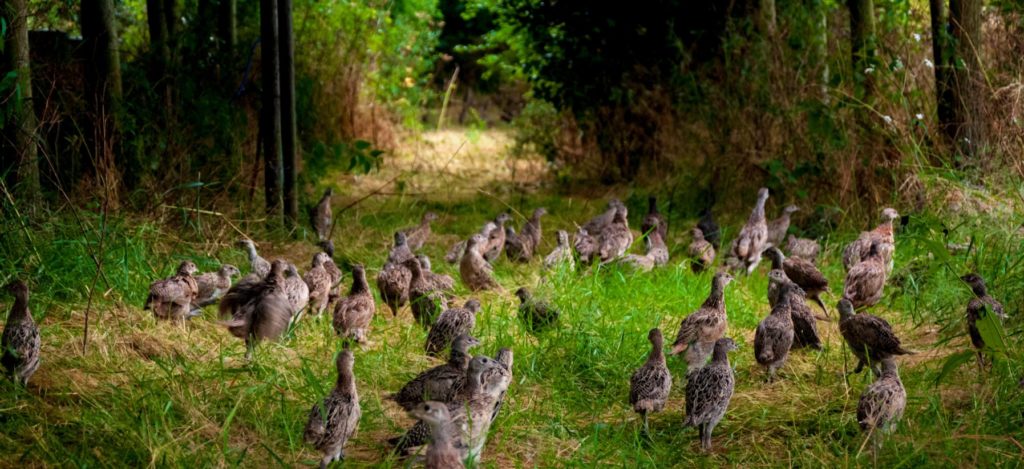
Estimating the occurrence of Common Pheasant Phasianus colchicus and Red-legged Partridge Alectoris rufa in terrestrial Natura 2000 sites in England.
Layperson’s summary (written by Wild Justice and approved by scientific collaborators) Wild Justice is taking legal action against DEFRA on their failure to assess the impacts of the very large numbers of non-native gamebirds on sites of high nature conservation importance. For Pheasants and Red-legged Partridges to have an impact on the ecology of a site then, for most impacts, they must be present on the site, although for some impacts being found nearby would be enough (eg through affecting the densities of generalist predators which may use the sites in questions for foraging). Birdwatchers often collect data on the presence or absence of birds in identifiable geographical locations. By collating the publicly available data from such birdwatchers’ observations and comparing those records with the boundaries of sites of conservation importance we examined how many sites of high conservation importance (Natura 2000 sites) had Pheasants, or Red-legged Partridges, or both, inside, probably inside, or at least very close to the Natura 2000 sites. This analysis shows that only two out of 313 terrestrial Natura 2000 sites in England lack records of Pheasants and Red-legged Partridges within or very close to their borders. Given that this method is almost certainly very conservative in identifying such sites, we have established that non-native gamebirds are present on the vast majority of English terrestrial Natura 2000 sites and therefore the scale of the task that DEFRA must undertake to assess any ecological impacts.
Technical Summary Terrestrial Natura 2000 sites in England were intersected with an irregular grid of post-2000 records of Common Pheasant and Red-legged Partridge, each cell scaled according to the spatial precision of the record(s) within it (maximum cell size = 2×2 km). Of the 313 Natura 2000 sites in England that have a terrestrial component, 33.5% entirely contained one or more cells with confirmed presence of Pheasant, 71.9% contained the central points of one or more cells with confirmed presence and 99.4% (all but two Natura sites) overlapped one or more cells with confirmed presence of Pheasant. The equivalent values for Red-legged Partridge were 18.2%, 53.4% and 85.6%, respectively. The average percentage of the land area of terrestrial Natura 2000 sites in England that fell within grid cells occupied by Pheasant was 93.0% (45.6% for Red-legged Partridge), and for a dissolved layer total land area of all SPAs and SACs combined, taking out the overlap between sites, it was 72.1% (31.9% for Red-legged Partridge). Pheasants are therefore present within, or immediately outside, practically all the terrestrial Natura 2000 sites in England, and Red-legged Partridges are present within, or immediately outside, a majority.
METHODS
Site boundary data
Polygon shapefile of all the UK’s Natura 2000 (N2K) sites downloaded from: https://www.eea.europa.eu/data-and-maps/figures/natura-2000-birds-and-habitat-directives-10/united-kingdom.
Bird location data
Location data for Common Pheasant and Red-legged Partridge were downloaded from NBN Atlas: https://nbnatlas.org/. These comprised mostly BTO data (up to 2015) but also included a small proportion of additional locations from other sources. To these were added eBird data filtered to a location accuracy of 100 m. Most NBN Atlas data come as point locations indicating the centre of a square grid cell within which the sighting was made; they do not usually indicate the precise location of the sighting itself. The associated accuracy codes indicate the size of the grid cell to which each sighting was assigned. Note that location accuracy in NBN is rather illogically coded such that a location accuracy of 1km refers to a point in a 1-km square
Data analysis
To estimate the occurrence of Pheasant and Red-legged Partridge in each Natura 2000 site with different levels of confidence, intersections were undertaken for each species using spatial joins in ArcGIS Pro to calculate three variables for each Natura 2000 site:
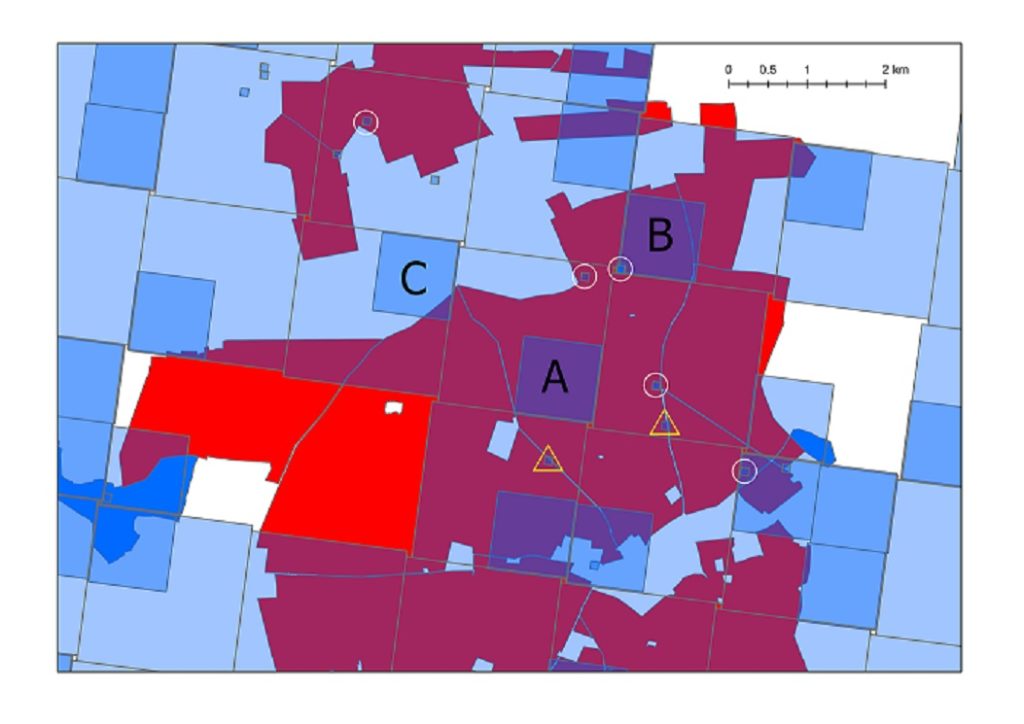
These are logically nested such that cells captured by intersection 1 are a subset of those captured by intersection 2, etc.. The first intersection, when applied to the example in Figure 1, would yield a count of six (cell “A” and the five much smaller cells circled in white). The second intersection would include these six, plus others whose centres fall in the site polygon (e.g. cell “B”, the 2-km cell immediately below it and the two much smaller cells contained within yellow triangles, plus others). The third intersection would include all cells already captured by the previous intersections plus any other cells that intersect any part of the site’s polygon, even if only to a small extent (e.g. cell “C”, plus many others).
In order to estimate the percentage of each Natura 2000 site’s area that falls within cells occupied by each species, the dissolved grid of occupied cells was intersected with the Natura 2000 layer using the “Tabulate intersection” tool in ArcMap. In the example shown in Fig. 1, this would calculate the percentage of the site that falls within blue cells (i.e. everything except the bright red portions of the site).
Once these intersections were complete, N2K sites that were terrestrial and fell entirely within England were extracted using the coding in the spreadsheet accessed here and selecting sites coded Country = “E” and Zone = “Terrestrial”. Sites listed in this document as being 100% marine were deleted. Some partly terrestrial sites have a marine or inshore component, e.g. some estuaries; for analyses of the percentage area of sites falling within grid cells occupied by each species, the marine component of such sites was excluded.
RESULTS
Filtering sites as described above returned a total of 313 Natura 2000 sites falling wholly within England that have a terrestrial component.
The filtered data contained 73,091 cell records of Pheasant (82.2% from BTO data via NBN Atlas, 14.2% from other sources via NBN Atlas, and 3.6% from eBird) and 26,123 cell records of Red-legged Partridge (with a similar breakdown of sources), spread across the UK. Of these, 9.9% were accurate to within less than 100 m, 36.2% were accurate to within around 500 m (i.e. they represented records presented at a 1×1-km cell level and 53.9% were accurate to within around 1 km (i.e. a 2×2-km cell level accuracy).
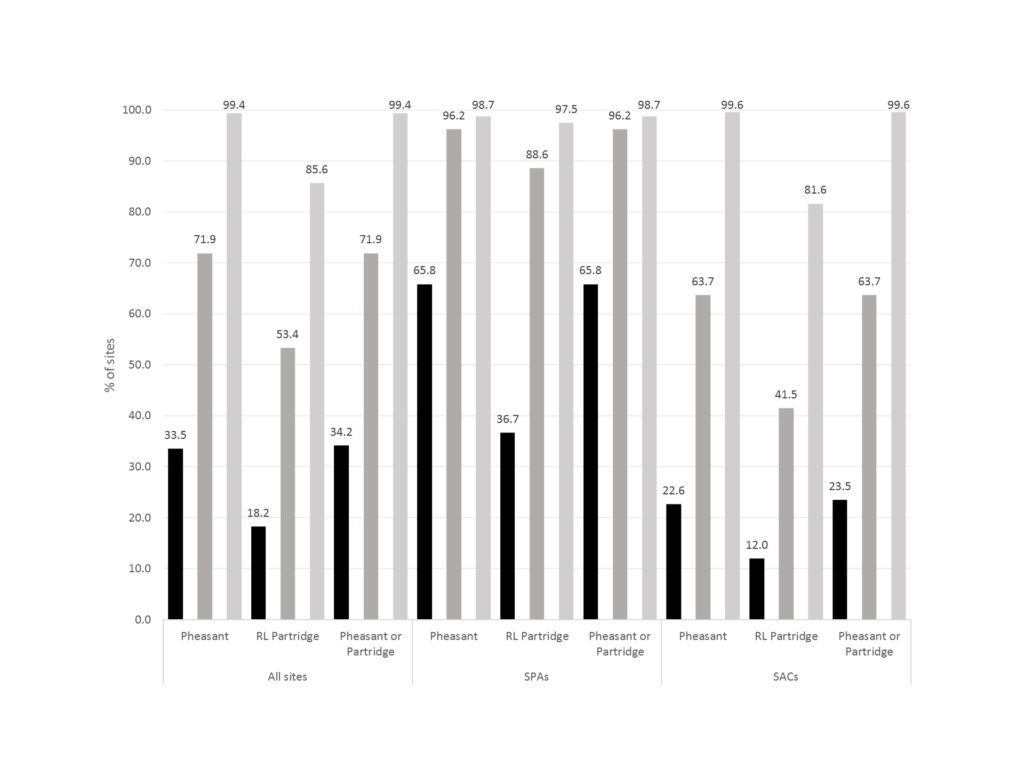
Fig. 2. Percentage of all terrestrial Natura 2000 sites in England (n = 313), and of SPAs (n = 79) and SACs (n = 234) separately, that completely contained one or more cells occupied by one or other species (black bars), that contained the centre(s) of one or more cells occupied by one or other species (mid-grey bars), and that intersected one or more cells occupied by one or other species (pale grey bars).
Figure 2 shows the percentage of terrestrial Natura 2000 sites in England that entirely contained at least one occupied cell, that contained the centre of at least one occupied cell and that overlapped at least one occupied cell, for each species separately and for both species combined (i.e. either Pheasant or Red-legged Partridge). Because the distribution of Red-legged Partridge records fell almost entirely within the distribution of Pheasant records, the combined plot for both species is almost identical to the plot for Pheasant. The percentage of SPAs wholly enclosing one or more occupied cells or containing the centres of occupied cells was higher for SPAs than for SACs, probably due at least in part to the larger area of the former (mean 94.8 km2 vs 36.2 km2).
The only two terrestrial N2K sites in England that did not intersect any cells occupied by either Pheasant or Red-legged Partridge were the Farne Islands, which presumably lie outside the dispersal range of mainland birds, and Fen Bog, a tiny site in the North Yorks Moors that falls 450 m from a cell with recorded presence of Red-legged Partridge and 1.2 km from a cell occupied by Pheasant.
The average percentage of the land area of terrestrial Natura 2000 sites in England that fell within grid cells occupied by Pheasant was 93.0% (45.6% for Red-legged Partridge). These figures do not take account of the fact that SPAs and SACs can overlap one another, and hence that a single record of Pheasant or Red-legged Partridge can fall within more than one Natura 2000 site. When the SPAs and SACs are dissolved into a non-overlapping layer of land under one or both designations, 72.1% of its area falls within cells occupied by Pheasant and 31.9% within cells occupied by Red-legged Partridge. The difference between these figures and the much higher site averages is due largely to the absence of Pheasants (or at least to a lack of records) from large parts of a small number of very large upland moorland Natura 2000 sites.
DISCUSSION (written by Wild Justice and approved by our scientific collaborators)
This report uses freely available bird observation data collected mainly by volunteer birdwatchers and made available through the application eBird or through Birdtrack or through more formal data collection exercises such as national surveys of distribution or numbers of birds, mainly organised by the British Trust for Ornithology. The fact that we could analyse these data is a testament to those many thousands of volunteers who collected the data and those who made the data publicly and freely available.
It is well known that Pheasants in particular, but Red-legged Partridges too, are widely distributed across most of England in practically all habitats (eg farmland of a variety of types, open moors and heaths, woodlands of all types) but the occurrence of these two non-native bird species in relation to sites of high conservation value have not before been examined to our knowledge. Our analysis, which shows, essentially, that these two non-native gamebirds, released for shooting for pleasure, are found on practically all Natura 2000 sites does not come as a surprise but is a novel result.
Might these data, or this analysis of them, overestimate the incidence of these birds on Natura 2000 sites? We feel it is unlikely. Pheasants and Red-legged Partridges are moderately large birds and can easily be identified, by sight or call, by many members of the public let alone the keen birdwatchers who mostly contribute to the datasets we have used. Therefore we feel that there is little chance of false positives in terms of misidentifications. We cannot think that the methods of analysis used would overestimate the presence of these birds on these sites.
In fact, these results are probably highly conservative in their findings given that they depend on visits to sometimes remote locations in England. If no-one has visited a site then there will be no records for us to examine. However, it is certainly the case that if there were more visits then there would be higher incidences of presence recorded in this dataset. There may be another small factor which leads to conservatism, some birdwatchers do not regard these two species as ‘real’ birds given that they are non-native and their numbers are hugely influenced by annual releases of captive-bred individuals and so may not think them worthy of recording.
These data only give clues to numbers of the two species present on Natura 2000 sites (as opposed to presence in unknown numbers) but the high incidence of presence suggests that numbers are appreciable at many sites (a conjecture born out by personal observation). Some of the datasets analysed by us could be used to explore this issue further and we have carried out some small-scale analyses for selected sites. Birdtrack data, allocated to well-known sites such as nature reserves (where they are contained, as they quite often are) within Natura 2000 sites, could be analysed to examine what proportion of visits where complete lists of birds seen were recorded, contain the relevant species. One could then identify for any Natura 2000 sites what proportion of visits to the sites recorded either Pheasants, Red-legged Partridges or both. It might then be possible to construct a league table of Natura 2000 sites ranked by the likelihood of non-native gamebird observations. Wild Justice has done some simple analyses with data which were to hand, to show that this is feasible and we recommend this approach to DEFRA. Perhaps DEFRA is already carrying out such an analysis but if they are then we are unaware of it.
These findings show that Natura 2000 sites in England have non-native gamebirds recorded within their boundaries, probably within their boundaries or near their boundaries with a very high incidence. This has implications for DEFRA’s review of impacts of these the non-native species of gamebird on the integrity of Natura 2000 sites.
Comments on this post: we will allow comments on this post, normally we do not allow comments. We will moderate (ie read and check before publishing or rejecting) any comments submitted. All comments should have a name (rather than a pseudonym) attached to them (although we won’t know whether it actually is your real name) and a valid email address. We are allowing comments so that any scientific points can be made about this scientific analysis – and we welcome those. An alternative to leaving a comment here is to email us at admin@tempo.samkilday.com
For GDPR purposes: we will know your name, email address and ip address if you submit a comment. If we reject your comment then your details will not be retained. If we publish your comment then we will have access to your name (real or not), email address and your ip address. We will not give or sell this information to anyone and we will only use it to contact you about your comment and because it is required information for the commenting software to operate.